How to avoid inaccurate wage data for SLPs
Most SLP pay norms are wildly inaccurate. We’ll show you which data sources to use, which to avoid, and how to interpret them.
The (brief) scoop:
As of 2025, the available pay data for speech–language pathologists is disappointingly weak and frequently misleading. Because of this, we started collecting new wage data this year. But until our numbers are higher, you'll still need to use ASHA's data, which is the only currently reliable wage data source. Literally all the others are wrong, and you should only use them if you know what you're looking at.
Want to take a look? Read on.
The (much longer) story:
Once upon a time (in 2024) when we started building Informed Jobs, we thought our field had decent local and national pay data available to speech–language pathologists. Oh how wrong we were... (*cries in misinformation…*)
What we found, instead, is that most available SLP wage data is wrong. And we don't mean "wrong" as in, "We're nitpicky nerds at The Informed SLP..." wrong. We mean "wrong" as in tens of thousands of dollars wrong. Amounts that EVERY SLP would care about, wrong.
Why? And how is it all wrong?
The reason for this is that SLP contracts are different than most, and highly variable. It means that datasets and resources that can be used by other professions (engineers, teachers, etc.) cannot be used by SLPs.
The issue is what we fondly refer to as "The 2080 Rule". It's a math error that literally every SLP wage data set we've ever seen online except ASHA's and ours makes.
How the 2080 Rule works:
When converting between hourly and annual wages, most online datasets will use the number 2080. This represents the total work hours in a year for someone working full-time (40 hours per week × 52 weeks = 2080 hours). The issue is, this calculation assumes that everyone in the dataset who's working full-time is paid for 40 hours every week for the entire year, which isn't accurate for SLPs.
- Over half of us are on 9 month contracts (school-based SLPs)
- Approximately 20% of us are on pay per visit (PPV) contracts (either in private practices or medical settings)
Only those who are salaried for 12 months out of the year does the 2080 calculation apply to, which is a very small group of SLPs.
OK. So what?
It's hard to emphasize just how much this can screw up a dataset, unless you start running the numbers yourself. So we'll create a pretend dataset to help it make sense! Here are 10 SLPs' wages. For simplicity's sake, let's assume they all live in Kansas City, and they all work full-time. Here is their name, setting, and contract rate:
| Sarah | Elementary School | $65,000 per year |
| Susan | Early Intervention | $55,000 per year |
| John | Hospital | $70,000 per year |
| Daphne | Hospital, PRN | $80 per hour |
| Joey | High School | $72,000 per year |
| Maya | Private Practice | $58 per hour |
| Jordan | Private Practice | $55 per hour |
| Taylor | Early Intervention | $50 per hour |
| Madison | SNF | $60 per hour |
| Stephanie | Acute Care | $78,000 per year |
With a quick glance, you can see that annual wages are $55,000 to $78,000. Then "hourly" rates are $50–$60 per hour, with one outlier at $75 per hour. All of these numbers makes sense, and are quite normal and average for Kansas City. But they make sense *to us as SLPS* because we know our contracts.
Others don't know our contracts. So when they get ahold of "hourly" and annual data like this, they start multiplying and dividing those numbers by 2080. They don't realize that $50/hour for us doesn't mean we're paid $50 for 40 hours in a week. It's often direct time only. And those school contracts? Those are 9 months. Hardly any of our contracts pay us for 40 hours per week, 12 months out of the year, for 2080 total hours.
But the 2080 rule gets applied anyway. To everything. All the annual rates are divided by 2080. All the hourly rates are multiplied by 2080. That makes the averages for this dataset, above:
$97,000 per year
$47 per hour
Ope! That doesn't make any sense, now does it? Look at the real data again. Nobody is making > $95,000 per year. Nor are their hourly contracts under $50. So how did that math get so, so screwed up? Try it for yourself. A $50/hour job is over six figures if you multiply 50 x 2080. Which is why you can't multiply it out that way. And why most available SLP wage data online is trash.
IMPORTANT NOTE: This is also why SLPs should never talk about their wages as "hourly". Because they almost never are. You can't compare apples to astronauts, but here we are doing it with each other all the time when we discuss wages...
The available SLP wage data:
There is limited reliable data available on SLP wages. The two most commonly used and largest datasets available are:
- ASHA’s Annual Salary Survey
- The Bureau of Labor Statistics: Occupational Employment and Wage Statistics (OEWS) data
Let’s take a look at each:
Resource #1 (Best): ASHA’s Annual Salary Surveys
Data collected:
Survey data was collected from 2,691 school-based SLPs in 2022 and 1677 healthcare SLPs in 2023. It is repeated biannually, so regularly up to date.
- Strengths: This is by far the most accurate data source we’ve found because ASHA correctly accounts for the SLP contract details that most other data sources mess up.
- Weaknesses: Raw data are not published, meaning you can’t calculate anything other than what they’ve already calculated for their report. The numbers are also too small to do anything really meaningful with the data, nationwide. In sum, it'd be better if it were larger and didn't do things like collapse by state.
Resource #2 (Mediocre-to-Useless): Bureau of Labor Statistics Occupational Employment and Wage Statistics (OEWS) survey
Data collected:
People tend to mistakenly think the BLS is a survey similar to ASHA’s, where people are outright asked about their wages in a certain year. However, that's not how the BLS data works. Instead, this data comes from state unemployment insurance (UI) files over a three-year period. For example, the data labeled "2024" was sampled through May 2023 and includes data as old as 2020 averaged into it, so it’s a more out-of-date than ASHA.
- Strengths: They collect lots of SLP wage data.
- Weaknesses: Their dataset is flat-out wrong, due to variability in SLP contracts. For the exact reason we laid out above, "The 2080 Rule". They're collapsing salaried, hourly, and pay-per-visit jobs, assuming all of us work and are paid for 40 hours per week, 12 months out of the year, for a total of 2080 work hours per year, which is inaccurate for at least 70% of our field, and skews all the data. (NOTE: They additionally collapse 1099 and W2 rates. Which isn't quite as big of a deal as collapsing contract types and assuming 2080 hours for everyone, but still. It'd be better if they didn't do that.)
The problem is, the BLS data is EVERYWHERE.
The BLS data powers most other sources we’ve found, like this wage calculator. Almost any time you find an "official" or seemingly "high quality" online wage calculator for SLPs or wage data, it's always from the BLS. Our field's scientists use the BLS data. Reporters use BLS data. Google, ChatGPT, Claude are all inaccurate due to the BLS data. It has snowballed into a problem everywhere online, which is why when SLPs who know our field Google SLP wages, it's always wrong and they know it. Which is why they resort to asking fellow SLPs on Facebook or Reddit instead.
Need more proof?
- Look at their data here. Elementary SLP average wage = $83,720/year and $40.25/hour. Notice the problem? They got $40.25 by dividing $83,720 by 2,080 (40 hours/week × 52 weeks). But school SLPs don't work year-round like that.
Another example: Let's say you're an SLP on a 1099 contract working full-time in a pay-per-visit (PPV) role, earning $65 per visit. SLPs know this only covers direct patient time, not a full 40-hour week. But the BLS incorrectly calculates: $65 × 2,080 hours = $135,200 annual salary. That's why BLS data makes SLP wages look unrealistically high.
In sum, you should use the ASHA data as your primary source, alongside our data, and only use the BLS only data with extreme caution and a full understanding of in which direction it’ll be inaccurate for your job in particular.
Now let's discuss some myths that really need busted in order for SLPs to be able to advocate for better pay...
MYTH #1: “I can ask other SLPs on Reddit or in a Facebook group about pay…”
Sure. Asking fellow SLPs is a good idea *if* you know what to ask! When asking about SLP pay online, make sure to include:
- Location
- 1099 vs. W2
- How you’re paid (salary, hourly, or pay per visit, and if you have any unpaid hours)
- Setting
And ask for fellow SLPs' annual pay, never hourly alone. Hourly rates are easily misunderstood and can lead to errors of $10,000–$50,000 when comparing jobs. For example:
- "$50/hour" = $60,000/year
- How? That's what you'd be paid if you're direct time only, with unpaid drive time between clients and unpaid cancellations.
- "$50/hour" = $104,000/year
- How? Because in this job, the SLP is paid for direct and indirect time with guaranteed hours.
See how it's the same hourly rate, both full-time work expectation, completely different pay? Always talk about contract details and annual pay!
MYTH #2: “I can look at pay averages from a variety of online sources, including the Bureau of Labor Statistics data (BLS), Indeed, Salary.com, ChatGPT, Claude, or Google to predict or negotiate pay.”
OMG did you read anything we wrote above?! Gently teasing here, but no. As we said above, the BLS data is incredibly misleading and inaccurate for SLPs in particular, due to how it's calculated. And the BLS data feeds almost everything else.
Also, you can't use job boards at all (like Indeed) because job post pay isn't the same as the average of what people are actually making. If it were, we wouldn't be asking SLPs about their pay; we'd just use our own jobs board data.
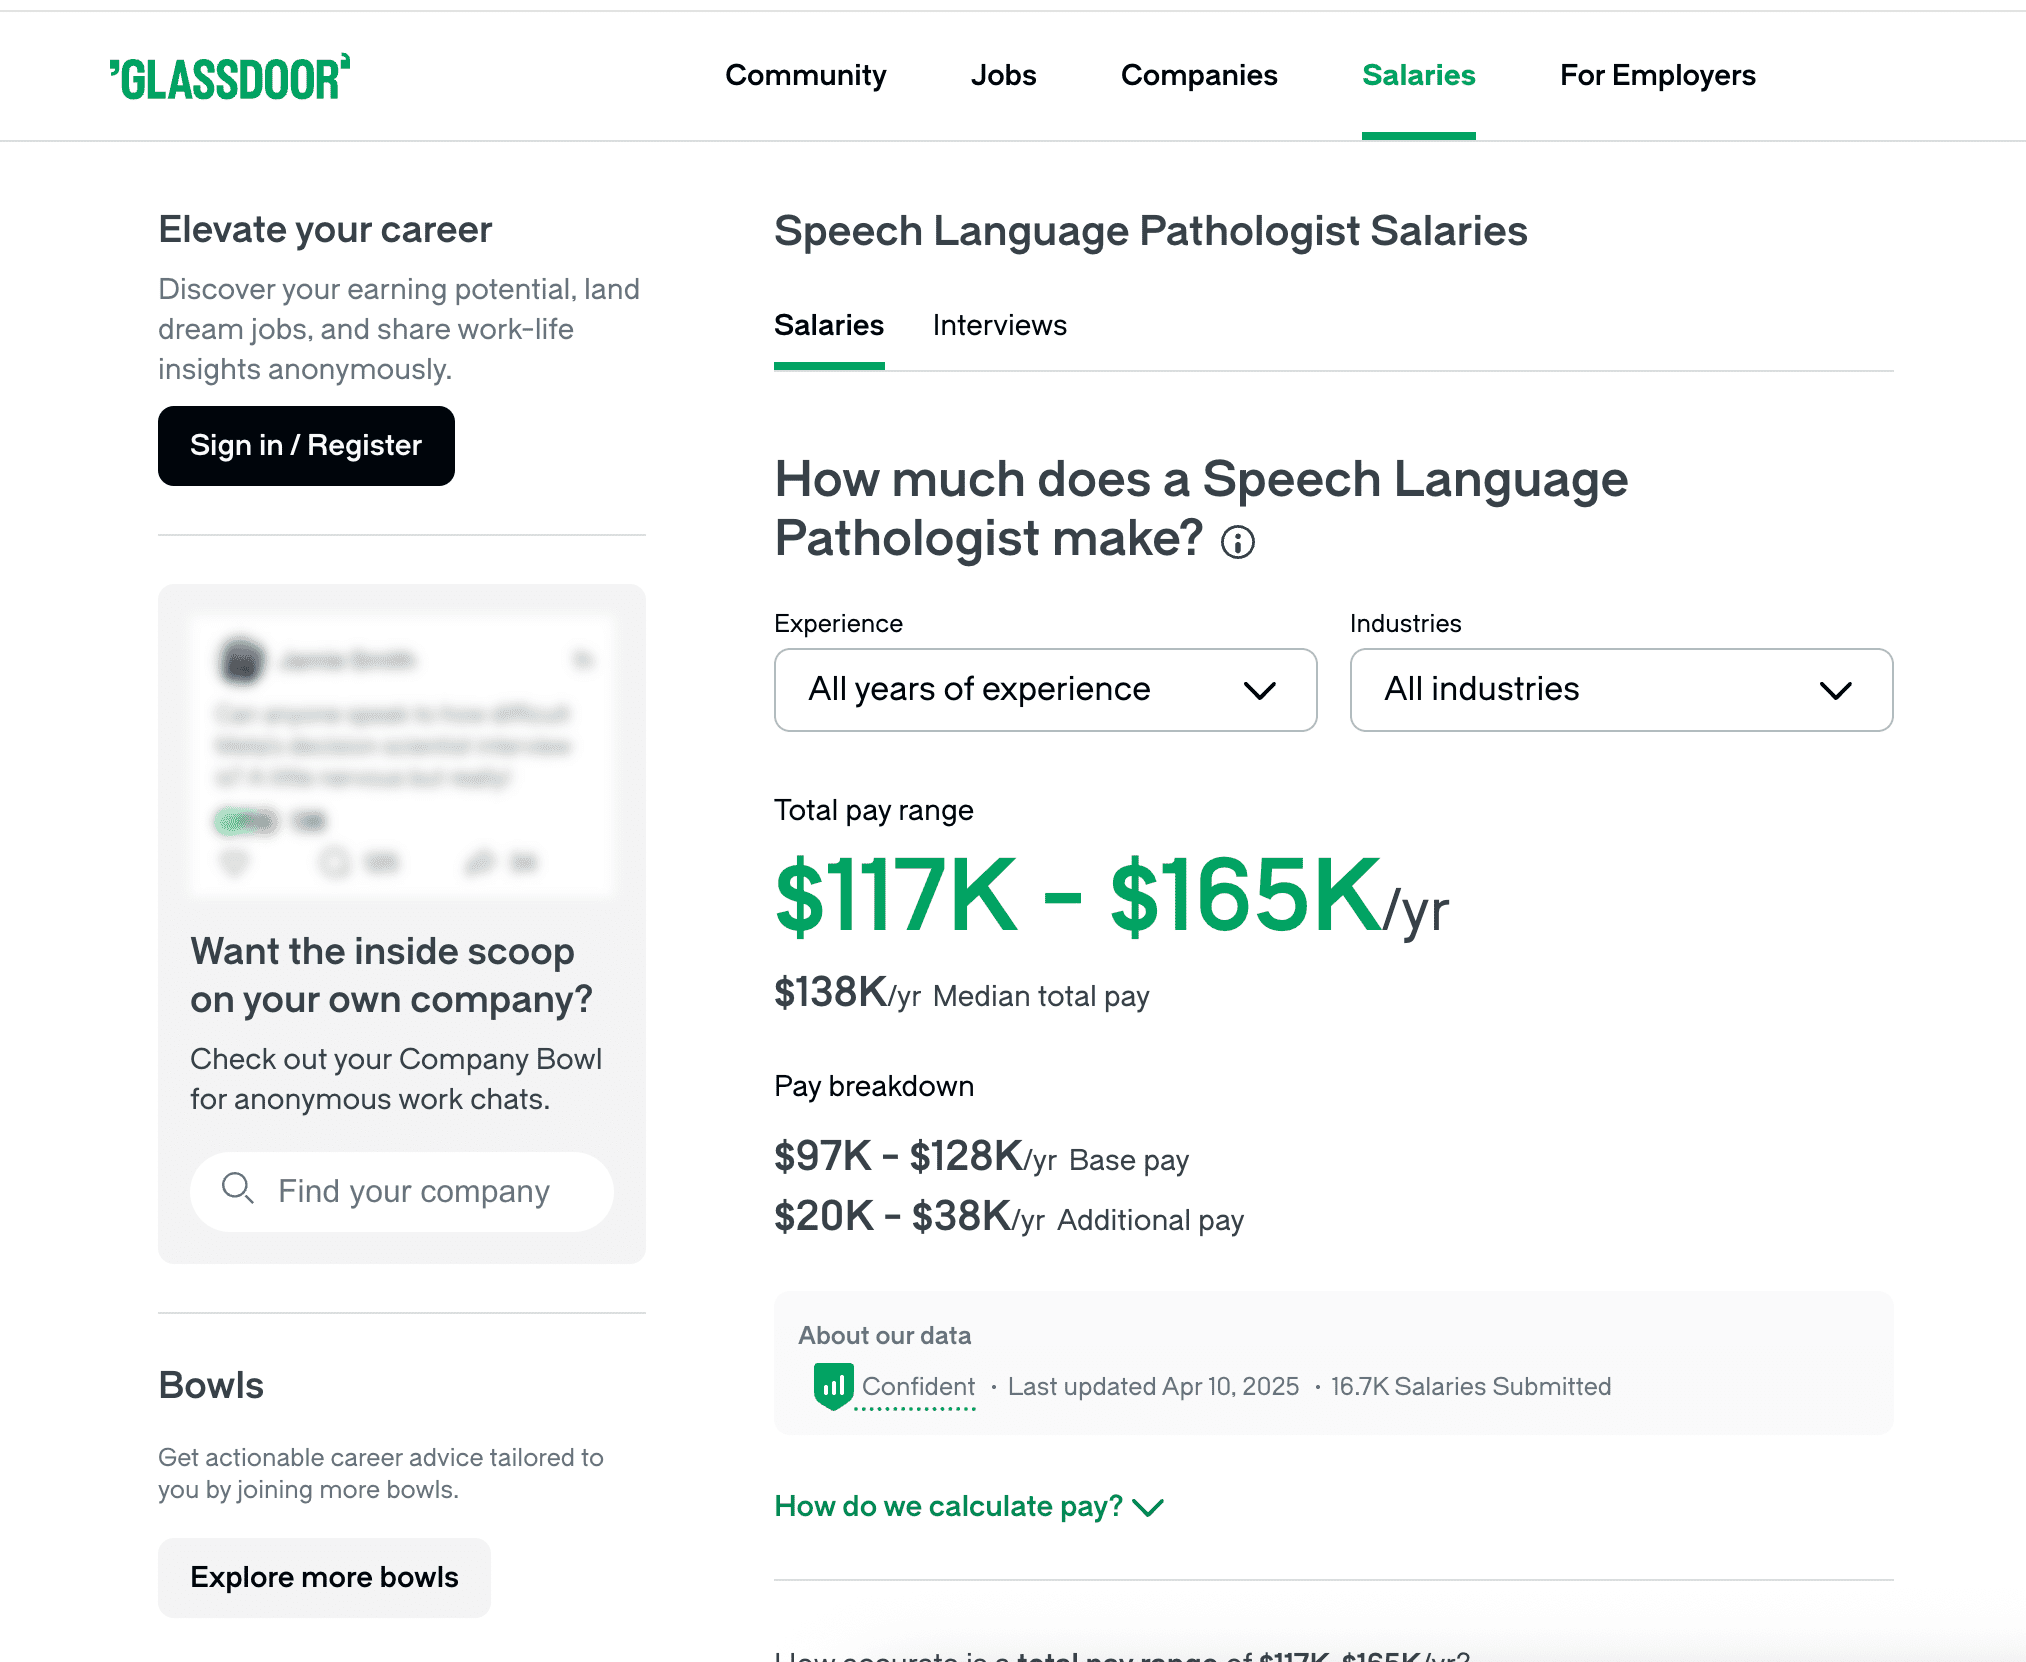
Want to see an example of the silly stuff you'll find online, which at first glance looks like it'd be a good dataset because it's large, but isn't?
This is a screenshot taken from Glassdoor’s website, January 2026:

Should we laugh? Should we cry? Either works, but for the grad students or non-SLPs looking at this screenshot, and wondering if it’s real– it’s about $45,000 too high, on both ends.
How did this happen? With the same error that the BLS and everyone else (except ASHA and us) seems to make. The "2080 Rule" we described, above.
Want better pay data for our field?
We want that, too! Help by sharing your wage data here.
Note: Because you're sharing your wage data freely, we'll NEVER put it behind a paywall. You can always see and download all the data, for your own use.
